|
The
Liquidity Forecast Ladder is a model that
can
dynamically quantify the level of liquidity
over
an appropriate set of time horizons:
- in a
"business-as-usual" environment
- during a
liquidity crisis
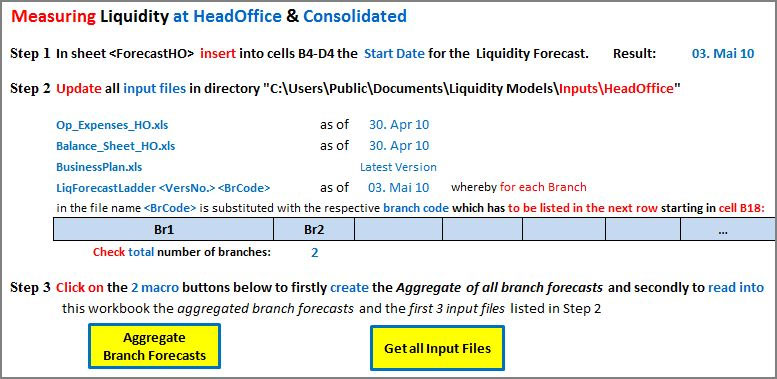
The realization of the model in an MS Excel based
tool allows financial institutions to measure, manage and stress test
liquidity by projecting cash inflows and outflows arising from assets and
liabilities in dependence of input variables whose influence can be tested
under various scenarios.
Product features
The Liquidity Forecast Ladder consists of
two
core components:
|
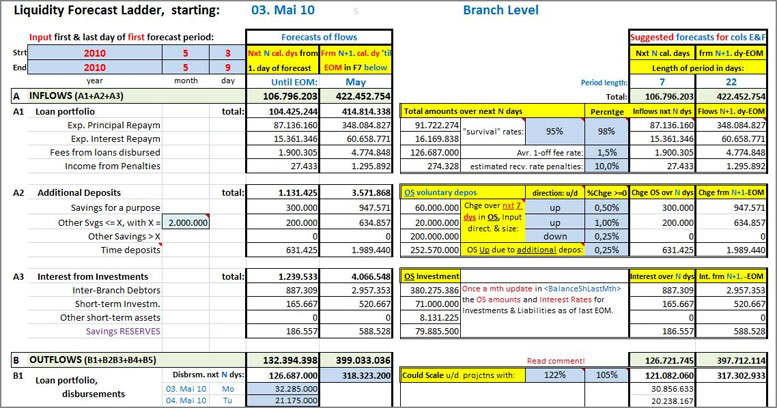
- The Branch Liquidity Forecast Ladder
covers two periods: the next N days (N <= 7) and from N+1st day
until end of month
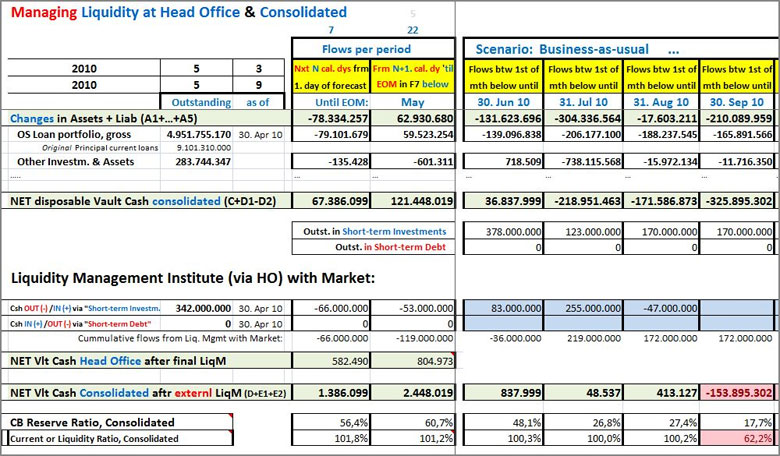
- The Head
Office and Consolidated Liquidity Forecast Ladder covers the above
two periods and additional 11-month period (12 month total)
The cash flows projections are based on the
detailed information such as:
- contractually expected inflows from the debt
service of performing borrowers, adjusted for anticipated arrears
- contractually expected outflows for loan
disbursal and maturing liabilities, with term deposits adjusted for
the “roll over effect”
- experienced level of stability (or “stickiness”) of customer funds with no contractual maturity
- actual / forecasted levels of interest and foreign exchange rates
|
|
Above: Projections of cash flows for the following 11 months are performed with the Consolidated Liquidity Forecast Ladder. These forecasts are based on the resulting numbers for the first two forecast periods and additional parameter settings allowing to incorporate:
- the business plan in a “business-as-usual”
environment
- an adjusted strategy concerning the loan
portfolio, savings & deposits, bank loans, etc. in a liquidity
crisis.
|